はじめに #
matplotlibライブラリを用いて、オブジェクト指向スタイルでグラフを作成する。
環境 #
| ソフトウェア | バージョン |
|---|---|
| spyder | 3.2.3 |
| python | 3.6.2 |
| matplotlib | 2.0.2 |
matplotlibのオブジェクト指向 #
matplotlibにおいて、グラフを作成するための主なクラスはfigureとaxesである。 figureオブジェクトは、グラフを表示するためのウィンドウに相当する。axesオブジェクトはグラフそのものである。1つのfigureオブジェクト上に複数のaxesオブジェクトを表示できる。
まず、pyplotモジュールを次のようにインポートする。
>>> import matplotlib.pyplot as pltfigure, axesオブジェクトの作成方法はいくつかある。
- add_axesメソッドを使う
fig = plt.figure()              # figureオブジェクトを作成
ax  = fig.add_axes((0,0,1,1))   # axesオブジェクトを作成
ax.plot([1,2], [3,4])           # plotメソッドでデータをプロット
plt.show() # グラフを表示- add_subplotメソッドを使う
fig = plt.figure()
ax  = fig.add_subplot(111)   # axesオブジェクトを作成
ax.plot([1,2], [3,4])
plt.show()- subplotsメソッドを使う
fig, ax = plt.subplots() # figure, axesオブジェクトを作成
ax.plot([1,2], [3,4])
plt.show()
実行すると、いずれも次のグラフが表示される(大きさは異なる場合がある)。
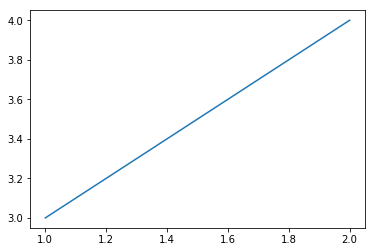
各関数・メソッドの説明を次節に示す。
figure, axesオブジェクトを作成する関数・メソッド #
plt.figure() #
plt.figure()は、figureオブジェクトを返す。
plt.figure(num=None, figsize=None, dpi=None, facecolor=None,
           edgecolor=None, frameon=True,
           FigureClass=<class 'matplotlib.figure.Figure'>,
           clear=False, **kwargs)
主な引数の型と意味を下表に示す。
| 引数 | 型 | 意味 |
|---|---|---|
| num | int or str | figureの番号または名前。指定しなければ順に加算される。 |
| figsize | touple of int | 図の幅と高さを指定(単位:インチ) |
| dpi | int | 解像度 |
| facecolor | 背景色 | |
| edgecolor | 境界の色 |
例:図の幅・高さをそれぞれ4, 3インチとし、背景を灰色にする。
>>> fig = plt.figure(figsize=(4, 3), facecolor="gray")
>>> ax  = fig.add_axes((0,0,1,1))
>>> ax.plot([1,2], [3,4])
>>> plt.show()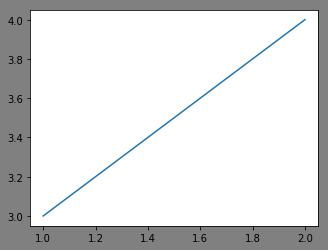
figure.add_axes() #
figure.add_axes()は、figure上に1個のaxesオブジェクトを作成する。
figure.add_axes=(rect, projection, poloar)主な引数の意味を下表に示す。
| 引数 | 型 | 意味 |
|---|---|---|
| rect | list or touple | axesの位置・大きさを指定 |
| projection | str | 投影方法(任意) |
| polar | bool | Trueなら極座標表示(任意) |
rectは、4つのfloatでaxesの[左端, 下端, 幅, 高さ]を指定する。 projection引数には、以下の投影方法を指定できる。
| 引数 | 意味 |
|---|---|
| “aitoff” | エイトフ図法 |
| “hammer” | ハンメル図法 |
| “lambert” | ランベルト図法 |
| “mollweide” | モルワイデ図法 |
| “polar” | 極座標 |
| “rectilinear” | 心射方位図法 |
figure.add_subplot() #
figure.add_subplot()は、figure上に1個のaxesオブジェクトを格子状に作成する。
figure.add_axes=(*args, projection, poloar)argsは可変長の引数を表し、「3つの整数を持つタプル」または「3桁の整数」である。 タプルの値を(I, J, K)とすると、I行J列の格子のK番目の位置にaxesを作成する。 タプル(I, J, K)は、3つの整数をIJKと並べた場合に等しい。
例:2行1列で2つのグラフを出力する。
fig = plt.figure()
ax1 = fig.add_subplot(211) # 2行1列の1番目
ax1.plot([1,2], [2,3])
ax2 = fig.add_subplot(212) # 2行1列の2番目
ax2.plot([1,2], [3,2])
plt.show()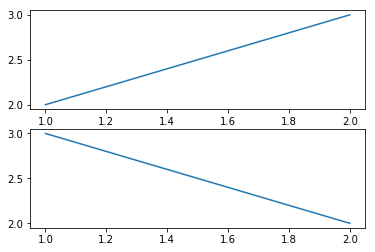
plt.subplots() #
plt.subplots()は次の2つのオブジェクトを作成する。
- figureオブジェクト
- axesオブジェクトの配列(または単体のaxesオブジェクト)
plt.subplots(nrows=1, ncols=1, sharex=False, sharey=False,
             squeeze=True, subplot_kw=None,
             gridspec_kw=None, **fig_kw)
主な引数の意味を以下に示す。
nrows, ncols: int型
グラフグリッドの行数・列数。
sharex, sharey: bool or {“none”, “all”, “row”, “col”}
複数のグラフのx, y軸の範囲(xlim, ylim)の共有。
- True or “all”: 全グラフで軸範囲を共有。
- False or “none”: 各グラフの軸範囲は独立。
- “row”: 各行のグラフが軸範囲を共有。
- “col”: 各列のグラフが軸範囲を共有。
squeeze: bool
axesオブジェクトの返し方を指定。
- Falseの場合、axesオブジェクトを常に2次元配列で返す。
- Trueの場合、nrows, ncolsの値によって、axesオブジェクト配列の次元を最小限にする。 ・nrows=ncols=1のとき、直接axesオブジェクトを返す。 ・nrowsとncolsの片方のみ1のとき、axesオブジェクトを1次元配列で返す。 ・nrowsとncolsの両方が2以上のとき、axesオブジェクトを2次元配列で返す。
subplot_kw: dict型
figure.add_subplot()のパラメータを指定する。
**fig_kw :
plt.figure()のパラメータを指定する。
例:2行2列のaxesオブジェクトを作成し、x軸の範囲は同じ列のグラフで共通、y軸の範囲は全グラフで共通とする。また、背景色を薄灰色にする(plt.figure()のパラメータ)。
fig, ax = plt.subplots(ncols=2, nrows=2,
                       sharex="col", sharey="all",
                       facecolor="lightgray")
print(ax)
ax[0,0].plot([1,2], [0,1]) # 左上
ax[0,1].plot([5,8], [1,2]) # 右上
ax[1,0].plot([1,2], [2,1]) # 左下
ax[1,1].plot([5,8], [2,0]) # 右下
plt.show()
実行結果 変数axはaxesオブジェクトの2x2配列になっている。
[[<matplotlib.axes._subplots.AxesSubplot object at 0x000000E5792E0588>
  <matplotlib.axes._subplots.AxesSubplot object at 0x000000E57A31D278>]
 [<matplotlib.axes._subplots.AxesSubplot object at 0x000000E579271BE0>
  <matplotlib.axes._subplots.AxesSubplot object at 0x000000E57A3DCFD0>]]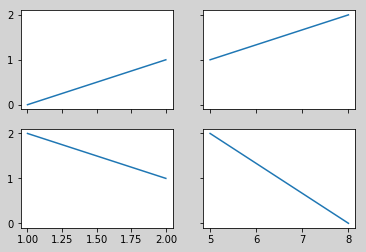
参考リンク #
matplotlib.pyplot.figure — Matplotlib 3.3.3 documentation matplotlib.pyplot.subplot — Matplotlib 3.3.3 documentation matplotlib.pyplot.subplots — Matplotlib 3.3.3 documentation