はじめに #
「ベイズ推論による機械学習入門」を読んだので、ベイズ推論(ベイズ推定)への理解を深めるため、多次元ガウス分布の学習をPythonで実装した。 参考にしたのは、講談社 機械学習スタートアップシリーズの「ベイズ推論による機械学習入門」(須山敦志 著)。3.4節「多次元ガウス分布の学習と予測」から、平均と精度(分散共分散行列)が共に未知の場合における学習について実装した。 また、学習したパラメータを用いて、未観測データを予測するための分布(予測分布)も構築した。
なお、以下のブログに離散確率分布(ベルヌーイ分布・カテゴリ分布・ポアソン分布)と1次元ガウス分布の学習の実装例があったため、併せて参考にさせて頂いた。
「ベイズ推論による機械学習入門」を読んだので実験してみた (その1)
環境 #
| ソフトウェア | バージョン |
|---|---|
| python | 3.6.5 |
| numpy | 1.14.3 |
| scipy | 1.1.0 |
| matplotlib | 2.2.2 |
以降では、各ライブラリを以下のようにインポートしていることを前提とする。
import math
import numpy as np
import scipy.stats
import matplotlib.pyplot as plt
ベイズ学習について #
ベイズ学習は、観測データと未知パラメータに対する同時確率分布を構築し、観測データが得られたときの未知パラメータの事後分布を求める手法である。 ここでは、多次元ガウス分布の平均と精度が未知パラメータとなる。
多次元ガウス分布のベイズ推論 #
\(D\)次元の多次元ガウス分布は、次式で表される。
$$ \mathcal{N}(x|\mu, \Sigma) = \frac{1}{\sqrt{(2\pi)^D|\Sigma|}} \exp \biggl( -\frac{1}{2} (x-\mu)^\top \Sigma^{-1} (x-\mu) \biggl) $$ここで、\( \mu \in \mathbb{R}^D\) は平均、\( \Sigma \in \mathbb{R}^{D \times D}\)は分散共分散行列である。 ただし、\(\Sigma\)は正定値行列(固有値が全て非負)でなければならない。 後々の数式を簡単にするため、精度行列\(\Lambda = \Sigma^{-1}\)を導入する。 \(\mu, \Lambda\)が推定したいパラメータになる。
\(\mu, \Lambda\)の確率分布を表現する共役事前分布は、ガウス・ウィシャート分布となる。
$$ \begin{array}{rl} p(\mu, \Lambda) &=& NW(\mu, \Lambda | m, \beta, \nu, W) \\\ &=& \mathcal{N}(\mu | m, (\beta \Lambda)^{-1}) \mathcal{W}(\Lambda | \nu, W) \end{array} $$ここで、\(m, \beta, \nu, W\)はガウス・ウィシャート分布のパラメータである。初期値は以下の条件を満たすように適当に与える。
- \(m \in \mathcal{R}^{D}\): 実数ベクトル
- \(\beta \in \mathcal{R}\): 実数
- \(\nu \in \mathcal{R}\): \(\nu > D-1\)を満たす実数
- \(W \in \mathcal{R}^{D \times D}\): 正定値行列(固有値が全て非負)
事後分布を計算すると、ガウス・ウィシャート分布のパラメータはそれぞれ以下のように与えられる(詳細は本を参照)。
$$ \hat{\beta} = N + \beta $$$$ \hat{m} = \frac{1}{\hat{\beta}} \left( \sum_{n=1}^N x_n + \beta m \right) $$
$$ \hat{W}^{-1} = \sum_{n=1}^N x_n x_n^{\top} + \beta mm^{\top} - \hat{\beta} \hat{m} \hat{m}^{\top} + W^{-1} $$
$$ \hat{\nu} = N + \nu $$
学習したガウス・ウィシャート分布のパラメータを使って、未観測のデータ\(x\)を予測する。予測分布は\(x\in \mathbb{R}^D\)上の多次元版のスチューデントのt分布となる。
$$ \mathrm{St} (x|\mu_s, \Lambda_s, \nu_s) = \frac{\Gamma( \frac{\nu_s+D}{2}) }{\Gamma( \frac{\nu_s}{2})} \frac{|\Lambda_s|^{\frac{1}{2}}}{(\pi \nu_s)^{\frac{D}{2}}} \biggl( 1+\frac{1}{\nu_s} (x-\mu_s)^{\top} \Lambda_s (x-\mu_s) \biggl)^{-\frac{\nu_s +D}{2} } $$ここで、スチューデントのt分布のパラメータは、ガウス・ウィシャート分布のパラメータを使って次式で与えられる。
$$ \mu_s = m $$$$ \Lambda_s = \frac{(1-D+\nu)\beta}{1+\beta}W $$
$$ \nu_s = 1-D+\nu $$
また、\(\Gamma(\bullet)\)はガンマ関数と呼ばれる関数である。
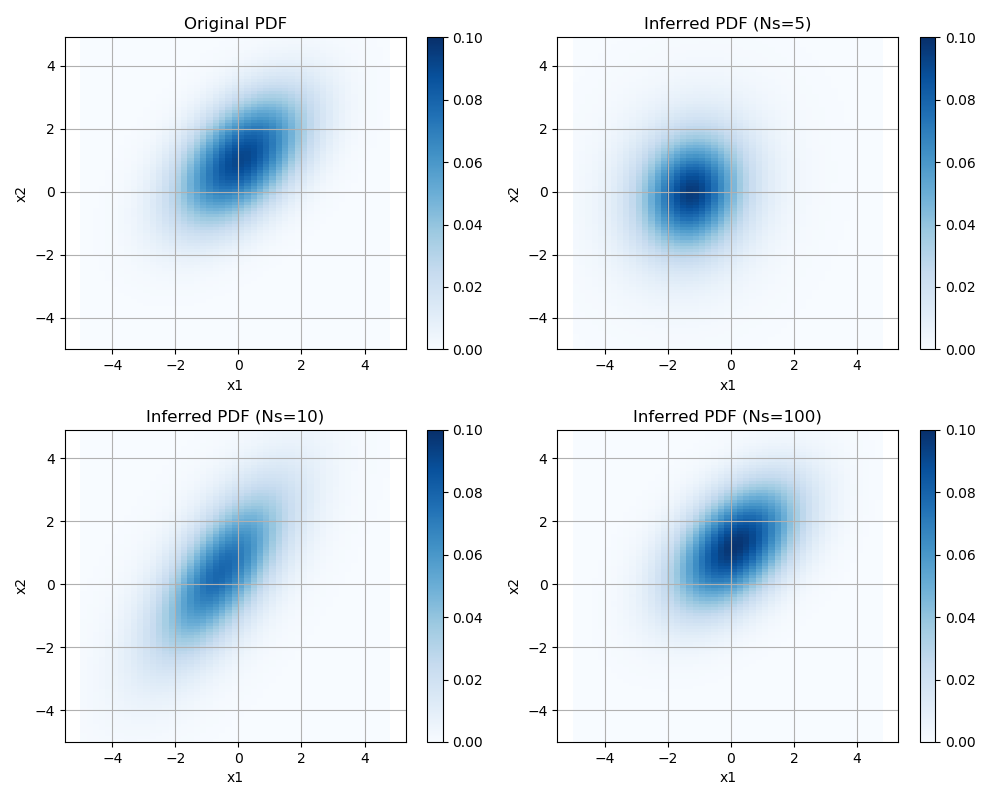
学習が進むにつれて、スチューデントのt分布の形状は、元の多次元ガウス分布の形状に近づいていく。
実装 #
ガウス・ウィシャート分布のパラメータ推定 #
観測データXから、ガウス・ウィシャート分布のパラメータの推定値\(\hat{m}, \hat{\beta}, \hat{\nu}, \hat{W}\)を推定する関数を以下のように実装する。
ただし、計算効率は重視せず、数式通りに実装することを優先している。
def multivariate_normal_fit(X):
    N = X.shape[0] # Number of samples
    D = X.shape[1] # Dimension of sample

    beta  = 1
    m     = np.zeros(D)
    W_inv = np.linalg.inv(np.diag(np.ones(D)))
    nu    = D

    beta_hat = N + beta
    m_hat    = (X.sum(axis=0)+beta*m)/beta_hat

    X_sum = np.zeros([D, D])
    for i in range(N):
        X_sum += np.dot(X[i].reshape(-1,1), X[i].reshape(1,-1))

    W_hat_inv = X_sum + beta*np.dot(m.reshape(-1,1), m.reshape(1,-1)) \
            - beta_hat*np.dot(m_hat.reshape(-1,1), m_hat.reshape(1,-1)) + W_inv
    nu_hat = N + nu

    return m_hat, beta_hat, nu_hat, W_hat_inv
多次元版のスチューデントのt分布 #
学習後の確率分布を確認するため、多次元版のスチューデントのt分布をクラスとして実装する。 確率密度関数 (Probability Density Function, PDF) を求めるため、pdfメソッドを用意した。pdfメソッドに配列を引数として与えると、その配列に対応する確率を返す。
class multivariate_student_t():
    def __init__(self, mu, lam, nu):
        # mu: D size array, lam: DxD matrix, nu: scalar
        self.D   = mu.shape[0]
        self.mu  = mu
        self.lam = lam
        self.nu  = nu

    def pdf(self, x):
        temp1 = np.exp( math.lgamma((self.nu+self.D)/2) - math.lgamma(self.nu/2) )
        temp2 = np.sqrt(np.linalg.det(self.lam)) / (np.pi*self.nu)**(self.D/2)

        if x.shape[0]==1:
            temp3 = 1 + np.dot(np.dot((x-self.mu).T, self.lam),  x-self.mu)/self.nu
        else:
            temp3 = []
            for a in x:
                temp3 += [1 + np.dot(np.dot((a-self.mu).T, self.lam),  a-self.mu)/self.nu]

        temp4 = -(self.nu+self.D)/2
        return temp1*temp2*(np.array(temp3)**temp4)
ここで、ガンマ関数の自然対数を返すmath.lgammaで実装した。
ガンマ関数math.gammaは大きな値を取り得ることがあり、以下のようにオーバーフローが生じる場合があるためである。
>>> math.gamma(200)
Traceback (most recent call last):

  File "<ipython-input-31-4fa9aaaad750>", line 1, in <module>
    math.gamma(200)

OverflowError: math range error
パラメータの学習 #
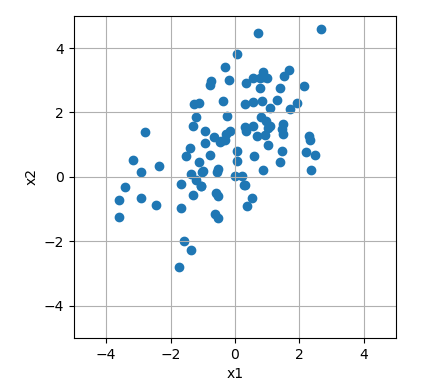
学習の結果を確認する。図示できるように、データの次元は\(D=2\)とする。 まず、多次元ガウス分布に従うサンプルデータを生成する。 ここで、データの平均は\((x_1, x_2)=(0, 1)\)であり、正の相関を持つ。
np.random.seed(0)

mean = np.array([0, 1])
cov  = np.array([[2, 1],
                 [1, 2]])
Ns   = 100                # Number of samples

X = np.random.multivariate_normal(mean, cov, Ns) # Sample data
サンプルデータを散布図にプロットする。
fig, ax = plt.subplots(figsize=(8, 4))
ax.scatter(X[:,0], X[:,1])
ax.axis('square')
ax.set_xlim(-5,5)
ax.set_ylim(-5,5)
ax.grid()
ax.set_xlabel("x1")
ax.set_ylabel("x2")
fig.tight_layout()
plt.show()

次に、関数multivariate_normal_fitから、ガウス・ウィシャート分布のパラメータを求める。
m_hat, beta_hat, nu_hat, W_hat_inv = multivariate_normal_fit(X)
得られたパラメータをスチューデントのt分布のパラメータに変換し、
multivariate_student_tオブジェクトを作成する。
D       = m_hat.shape[0]
mu_hat  = m_hat
lam_hat = (1-D+nu_hat)*beta_hat*np.linalg.inv(W_hat_inv) / (1+beta_hat)
nu_hat  = 1 - D + nu_hat

mt = multivariate_student_t(mu_hat, lam_hat, nu_hat)
最後に、元のガウス分布の形状と、推定したスチューデントのt分布の形状を比較する。 両確率分布の確率を、x1, x2とも-5~5の範囲で求める。
X1, X2 = np.meshgrid(np.arange(-5, 5, 0.1), np.arange(-5, 5, 0.1))
Y = np.vstack([X1.ravel(), X2.ravel()]).T

mn_pdf = scipy.stats.multivariate_normal.pdf(Y, mean=mean, cov=cov)
mn_pdf = mn_pdf.reshape(X1.shape[0], -1)

mt_pdf = mt.pdf(Y)
mt_pdf = mt_pdf.reshape(X1.shape[0], -1)
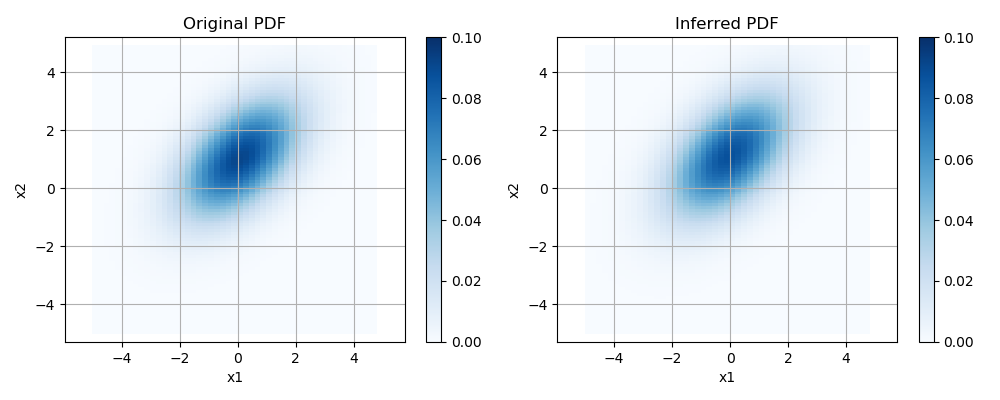
これらをヒートマップに表示する。色が濃いほど確率が高いことを表す。 このように、推定した確率密度関数と、元の確率密度関数はほぼ一致している。
fig, ax = plt.subplots(ncols=2, figsize=(10, 4))
ax0 = ax[0].pcolor(X1, X2, mn_pdf, cmap="Blues", vmin=0, vmax=0.1)
ax1 = ax[1].pcolor(X1, X2, mt_pdf, cmap="Blues", vmin=0, vmax=0.1)
for i in range(2):
    ax[i].axis('equal')
    ax[i].grid()
    ax[i].set_xlabel("x1")
    ax[i].set_ylabel("x2")
ax[0].set_title("Original PDF")
ax[1].set_title("Inferred PDF")
plt.colorbar(ax=ax[0], mappable=ax0)
plt.colorbar(ax=ax[1], mappable=ax1)
fig.tight_layout()
plt.show()

以上をまとめたコードは以下の通り。
import math
import numpy as np
import scipy.stats
import matplotlib.pyplot as plt

class multivariate_student_t():
    def __init__(self, mu, lam, nu):
        # mu: D size array, lam: DxD matrix, nu: scalar
        self.D   = mu.shape[0]
        self.mu  = mu
        self.lam = lam
        self.nu  = nu

    def pdf(self, x):
        temp1 = np.exp( math.lgamma((self.nu+self.D)/2) - math.lgamma(self.nu/2) )
        temp2 = np.sqrt(np.linalg.det(self.lam)) / (np.pi*self.nu)**(self.D/2)

        if x.shape[0]==1:
            temp3 = 1 + np.dot(np.dot((x-self.mu).T, self.lam),  x-self.mu)/self.nu
        else:
            temp3 = []
            for a in x:
                temp3 += [1 + np.dot(np.dot((a-self.mu).T, self.lam),  a-self.mu)/self.nu]

        temp4 = -(self.nu+self.D)/2
        return temp1*temp2*(np.array(temp3)**temp4)

def multivariate_normal_fit(X):
    N = X.shape[0] # Number of samples
    D = X.shape[1] # Dimension of sample

    beta  = 1
    m     = np.zeros(D)
    W_inv = np.linalg.inv(np.diag(np.ones(D)))
    nu    = D

    beta_hat = N + beta
    m_hat    = (X.sum(axis=0)+beta*m)/beta_hat

    X_sum = np.zeros([D, D])
    for i in range(N):
        X_sum += np.dot(X[i].reshape(-1,1), X[i].reshape(1,-1))

    W_hat_inv = X_sum + beta*np.dot(m.reshape(-1,1), m.reshape(1,-1)) \
            - beta_hat*np.dot(m_hat.reshape(-1,1), m_hat.reshape(1,-1)) + W_inv
    nu_hat = N + nu

    return m_hat, beta_hat, nu_hat, W_hat_inv

if __name__=="__main__":
    np.random.seed(0)

    mean = np.array([0, 1])
    cov  = np.array([[2, 1],
                     [1, 2]])
    Ns   = 100                # Number of samples

    X = np.random.multivariate_normal(mean, cov, Ns) # Sample data

    fig, ax = plt.subplots(figsize=(8, 4))
    ax.scatter(X[:,0], X[:,1])
    ax.axis('square')
    ax.set_xlim(-5,5)
    ax.set_ylim(-5,5)
    ax.grid()
    ax.set_xlabel("x1")
    ax.set_ylabel("x2")
    fig.tight_layout()
    plt.show()

    m_hat, beta_hat, nu_hat, W_hat_inv = multivariate_normal_fit(X)

    D       = m_hat.shape[0]
    mu_hat  = m_hat
    lam_hat = (1-D+nu_hat)*beta_hat*np.linalg.inv(W_hat_inv) / (1+beta_hat)
    nu_hat  = 1 - D + nu_hat

    mt = multivariate_student_t(mu_hat, lam_hat, nu_hat)

    X1, X2 = np.meshgrid(np.arange(-5, 5, 0.1), np.arange(-5, 5, 0.1))
    Y = np.vstack([X1.ravel(), X2.ravel()]).T

    mn_pdf = scipy.stats.multivariate_normal.pdf(Y, mean=mean, cov=cov)
    mn_pdf = mn_pdf.reshape(X1.shape[0], -1)

    mt_pdf = mt.pdf(Y)
    mt_pdf = mt_pdf.reshape(X1.shape[0], -1)

    fig, ax = plt.subplots(ncols=2, figsize=(10, 4))
    ax0 = ax[0].pcolor(X1, X2, mn_pdf, cmap="Blues", vmin=0, vmax=0.1)
    ax1 = ax[1].pcolor(X1, X2, mt_pdf, cmap="Blues", vmin=0, vmax=0.1)
    for i in range(2):
        ax[i].axis('equal')
        ax[i].grid()
        ax[i].set_xlabel("x1")
        ax[i].set_ylabel("x2")
    ax[0].set_title("Original PDF")
    ax[1].set_title("Inferred PDF")
    plt.colorbar(ax=ax[0], mappable=ax0)
    plt.colorbar(ax=ax[1], mappable=ax1)
    fig.tight_layout()
    plt.show()
また、学習データのサンプル数Nsを5, 10, 100と変えて、推定精度に与える影響を調べる。下図のように、Nsが増えるほど、元の確率密度分布(左上)に近づいている。

