はじめに #
matplotlibにはスタイルと呼ばれる、グラフの見た目を変更できるプリセットが用意されている。 スタイルを活用することで、グラフの見た目を簡単に変更できる。
環境 #
| ソフトウェア | バージョン |
|---|---|
| Anaconda3 | 5.2.0 |
| Python | 3.6.5 |
| matplotlib | 2.2.2 |
はじめに #
本記事では、各ライブラリを以下のようにインポートしていることを前提とする。
import matplotlib as mpl
import matplotlib.pyplot as plt
スタイルの設定 #
以下のコマンドでmatplotlibで利用できるスタイルの一覧をリスト形式で取得できる。
plt.style.available実行結果 matplotlibのバージョンや、他にインストールしているライブラリによって異なる場合がある。
['bmh',
 'classic',
 'dark_background',
 'fast',
 'fivethirtyeight',
 'ggplot',
 'grayscale',
 'seaborn-bright',
 'seaborn-colorblind',
 'seaborn-dark-palette',
 'seaborn-dark',
 'seaborn-darkgrid',
 'seaborn-deep',
 'seaborn-muted',
 'seaborn-notebook',
 'seaborn-paper',
 'seaborn-pastel',
 'seaborn-poster',
 'seaborn-talk',
 'seaborn-ticks',
 'seaborn-white',
 'seaborn-whitegrid',
 'seaborn',
 'Solarize_Light2',
 'tableau-colorblind10',
'_classic_test']この中の1つをplt.style.useで設定すると、グラフの見た目を変更できる。
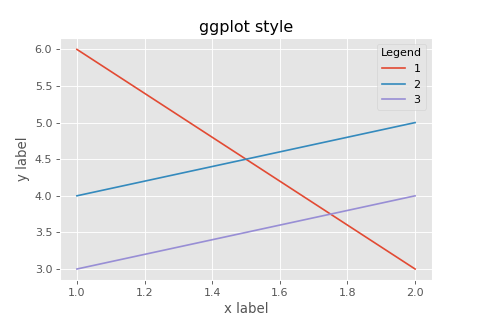
例
plt.style.use('ggplot')

fig, ax = plt.subplots()
ax.plot([1,2], [6,3])
ax.plot([1,2], [4,5])
ax.plot([1,2], [3,4])
ax.set_xlabel("x label")
ax.set_ylabel("y label")
ax.set_title(style+" style")
ax.legend(["1", "2", "3"], title="Legend")
plt.show()
実行結果
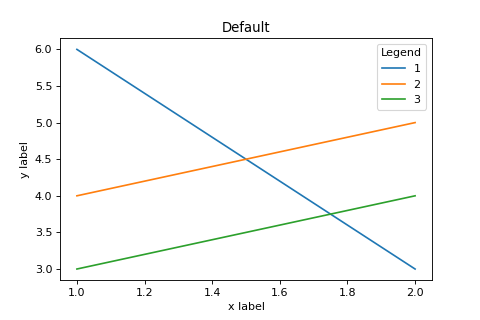
なお、デフォルトのグラフは以下の通り。
注意したいのが、あるスタイルを設定した後に、別のスタイルを設定しても、グラフの表示に関するパラメータが全て上書きされないこと。例えば、"fast"スタイルで上書きされるパラメータは、わずか3個である。
グラフの見た目を試行錯誤して所望の表示になったとしても、Pythonを再び立ち上げると、同じ表示にならない場合がある。
スタイルの表示例 #
主なグラフを描画してみる(いずれもデフォルトから直接変更した場合)。
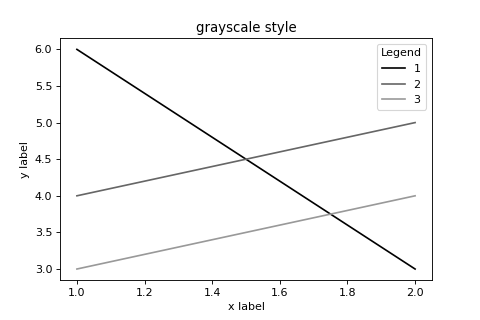
grayscale #
モノクロ印刷する場合に。
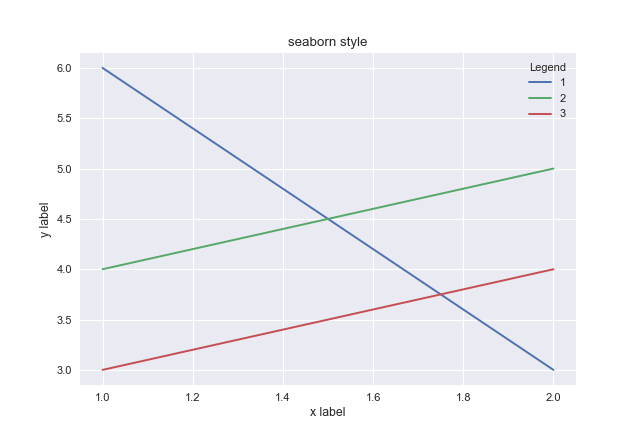
seaborn #
seabornから逆輸入されたのかもしれない。
なお、公式リファレンスに各スタイルで出力したグラフの一覧がある。 Style sheets reference — Matplotlib 3.3.3 documentation
さらにグラフの見た目を変更する #
スタイルのパラメータ設定ファイルは以下のディレクトリにある。
Anaconda3\Lib\site-packages\matplotlib\mpl-data\stylelib
拡張子がmplstyleとなっているが、テキストエディタで編集可能である。 自分でスタイル設定ファイルを作成すれば、スクリプトを描くたびに細かい設定を変更する手間が省ける。
また、現在の設定は以下のコマンドで確認できる。
mpl.rcParams実行結果
RcParams({'_internal.classic_mode': False,
          'agg.path.chunksize': 0,
          'animation.avconv_args': [],
          'animation.avconv_path': 'avconv',
          'animation.bitrate': -1,
(以下略)RcParamsを変更することで、スタイル設定ファイルを書き換えずにグラフの見た目を変更できる。
また、同じスクリプト内であれば、グラフ作成の度に設定する必要はなくなる。例えば、グラフにグリッドを表示したい場合、以下のように設定する。
mpl.rcParams["axes.grid"] = True参考 #
matplotlib.style — Matplotlib 3.3.3 documentation matplotlibのstyleを変える - Qiita