はじめに #
Matplotlibでグラフの軸の目盛りを整数にするには、MaxNLocatorクラスを使用します。
検証環境は以下の通りです。
| ソフトウェア | バージョン |
|---|---|
| Python | 3.9.7 |
| matplotlib | 3.4.3 |
軸の目盛りを整数にする #
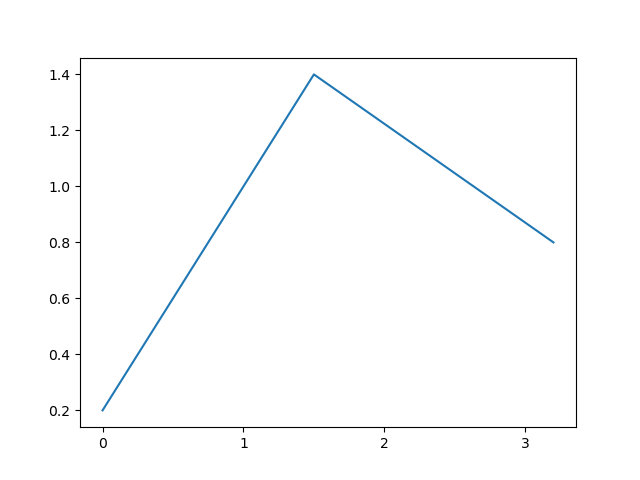
軸の目盛りを整数にするには、set_major_locatorメソッドにMaxNLocator(integer=True)を渡します。x軸を整数にする例を以下に示します。
import matplotlib.pyplot as plt
from matplotlib.ticker import MaxNLocator

x = [0,1,3]
y = [0,5,2]

fig, ax = plt.subplots()
ax.plot(x, y)
ax.xaxis.set_major_locator(MaxNLocator(integer=True))
plt.show()
実行結果
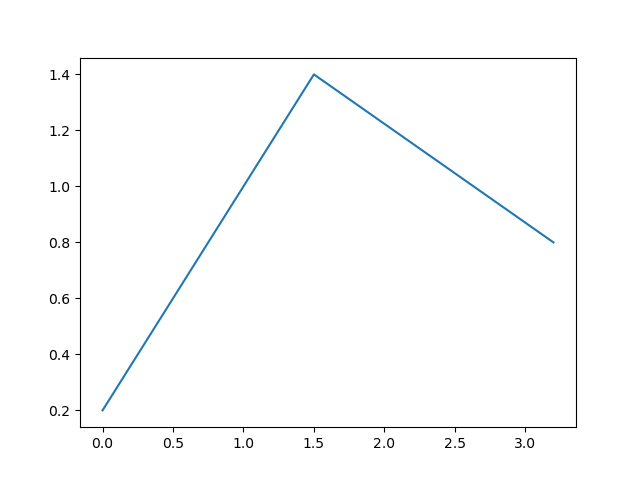
なお、ax.xaxis.set_major_locator(MaxNLocator(integer=True))を削除すると、以下のようにx軸は小数になります。
y軸の目盛りを整数にする場合は以下のようにします。
ax.yaxis.set_major_locator(MaxNLocator(integer=True))
もしくは、以下のようにget_xaxis(), get_yaxis()メソッドを使っても同じ結果になります。
ax.get_xaxis().set_major_locator(MaxNLocator(integer=True))
ax.get_yaxis().set_major_locator(MaxNLocator(integer=True))